# import packages
from pystoned import CNLS
from pystoned.plot import plot3d
from pystoned.constant import CET_ADDI, FUN_PROD, OPT_LOCAL, RTS_VRS
from pystoned.dataset import load_Tim_Coelli_frontier
# import the data from Tim Coelli Frontier 4.1
data = load_Tim_Coelli_frontier(x_select=['capital', 'labour'],
y_select=['output'])
# define and solve the CNLS model
CNLS_model = CNLS.CNLS(y=data.y, x=data.x, z=None, cet = CET_ADDI, fun = FUN_PROD, rts = RTS_VRS)
CNLS_model.optimize(OPT_LOCAL)
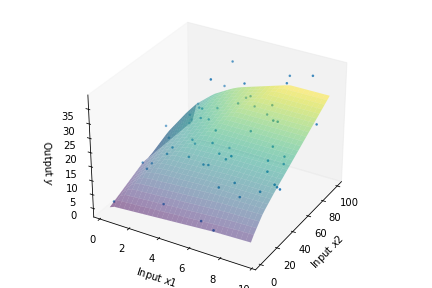
# Plot the estimated function
plot3d(CNLS_model,x_select_1=0, x_select_2=1, fig_name="CNLS_3d")